The S&P 500 is up 12.8% this year and sits less than 1% below its record. The 10-year Treasury yield just closed September at its highest level since June 2007. History says Q4 is the strongest stretch of the calendar, but this year's setup comes with a few twists. The Q4 Endgame is our 10-strategy playbook for the rest of the year, with the dates to act on.
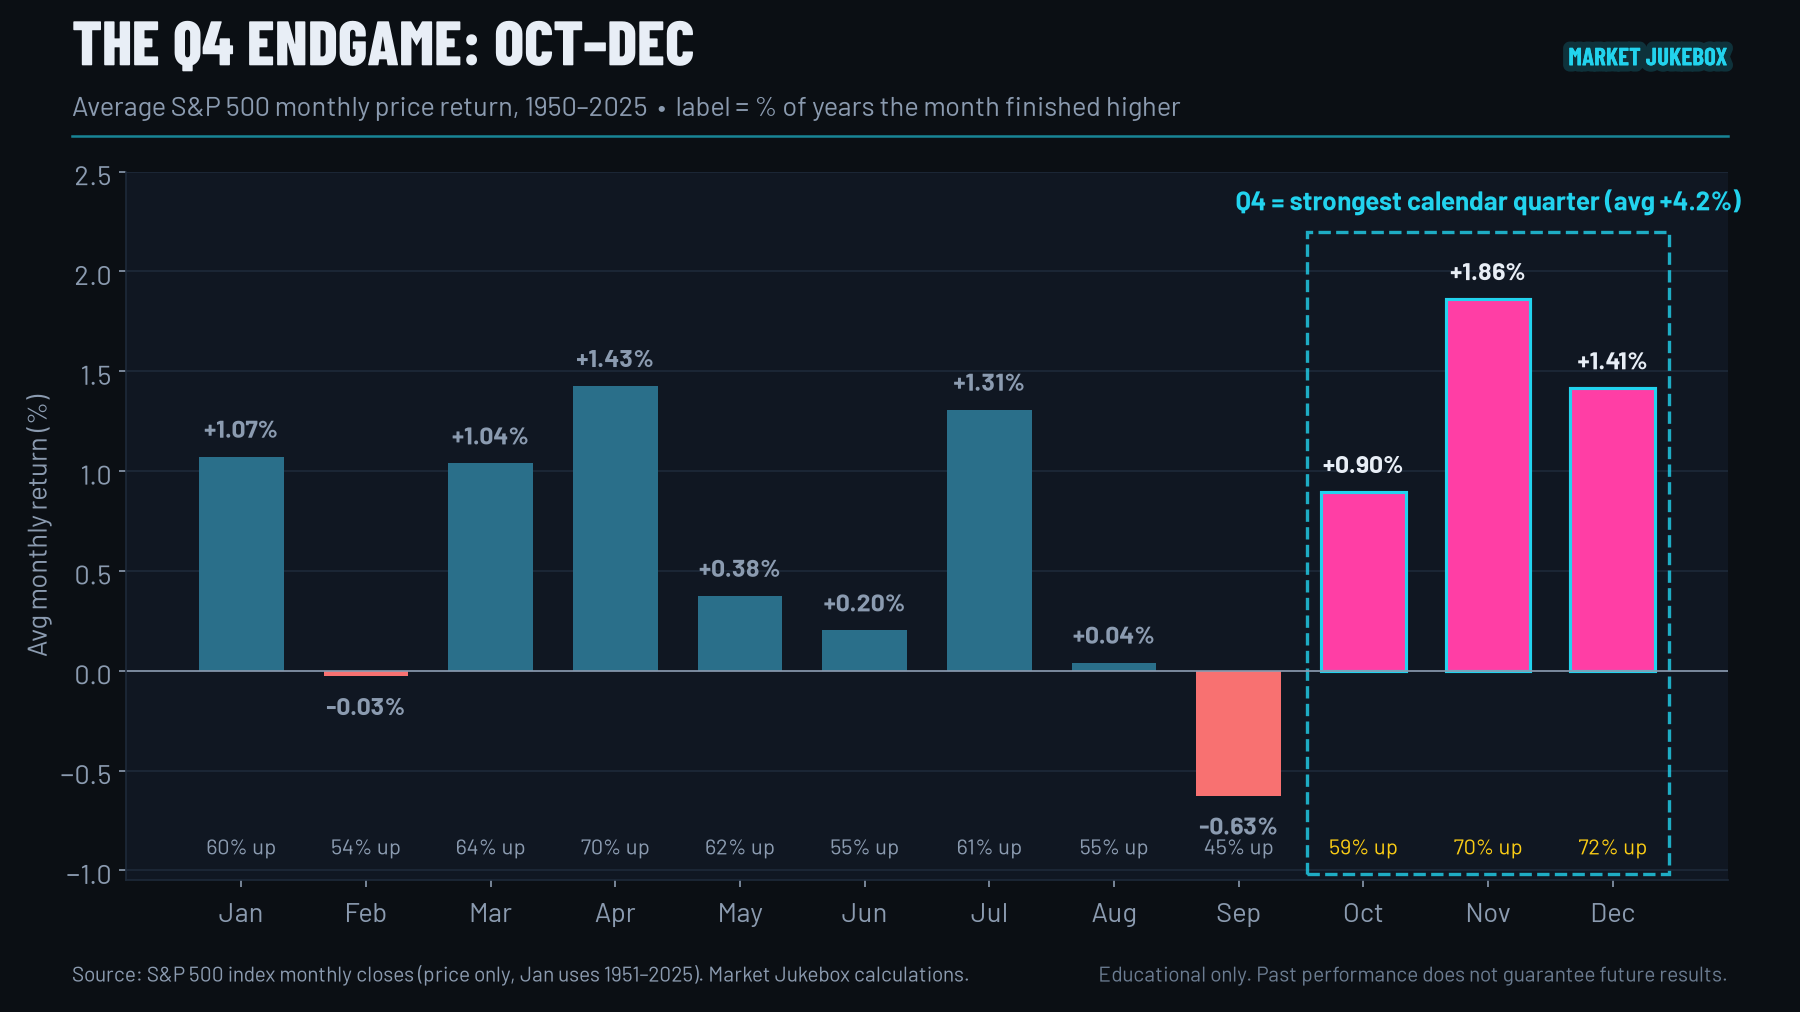
Average S&P 500 Q4 return since 1950, the best quarter of the year
Midterm-year Q4s that finished higher (average +6.6%)
Midterm years when the S&P 500 was higher the next June 30 than on Election Day
10-year Treasury yield at the Sep 30 close, the highest since June 2007
S&P 500 index price closes, 1950–2025; U.S. Treasury daily par yield curve rates. Past performance does not guarantee future results.
If you've been watching the market this fall, you've probably felt it: the index looks fine, but something under the hood doesn't.
Here's what the data says. The S&P 500 closed Friday at 7,722.72, up 12.81% year to date and just 0.98% below its Aug 13 record close. But September was a one-sector market. Technology beat SPY by 5.5 points, and nine of the 11 sectors trailed it. The Dow fell 4.29% for the month.
Meanwhile, the bond market got loud. The 10-year yield closed at 5.29% on Sep 30, its highest since June 2007, and was still at 5.28% on Friday. The Fed raised rates in September. And all of this is happening in a midterm-election year, which has historically produced the strongest Q4 of the four-year cycle.
There's a twist, though. The typical midterm year is down about 2.8% by late September and then rallies off a low base. 2026 entered Q4 up nearly 12%. So the usual Q4 playbook needs adjusting, and that's exactly what our research team spent the last few weeks doing.
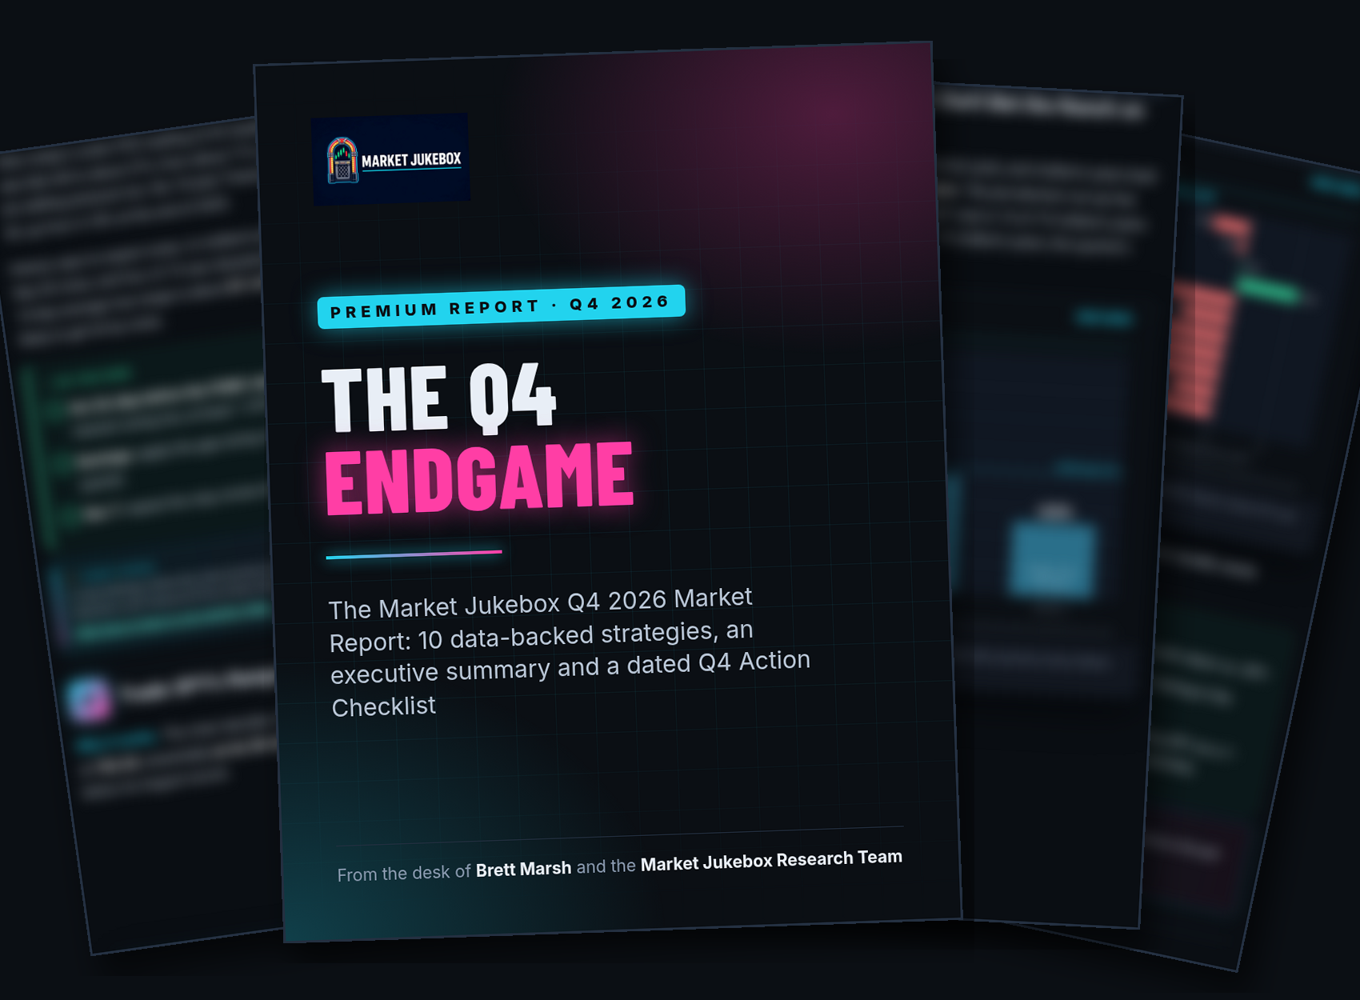
The result is The Q4 Endgame: our premium Q4 2026 Market Report. It's 10 data-backed strategies, an executive summary you can read in five minutes, and a dated Q4 Action Checklist so you know what to do and when.
Brett Marsh, Market Jukebox
The whole quarter on one page: where the market stands, what history says, and the handful of moves that matter most.
Why Q4 has been the best quarter since 1950, and the twist that makes 2026 different.
What every midterm year since 1950 says about the road to Election Day, and how we'd pace new money.
The most consistent signal in the four-year cycle, and the trigger we'd use to act on it.
What 2026's real returns did to two common portfolios, and a staged way to fix the drift.
Gap math, position sizing and a real example from this week's tape.
Two Fed meetings, an election and a 5%+ 10-year in six weeks: where stops belong and when to review them.
The levels that matter, with bullish, neutral and bearish triggers.
Sector rotation through Q3 and September, plus the broadening signal we're watching.
Holiday liquidity, quad witching, window dressing, and the window you don't want to miss.
How to build next year's watchlist now, and one popular idea to skip.
Every action from the report on one dated, printable checklist, from this week to Dec 31.
Earnings kickoff, both Fed meetings, the election, half-days, quad witching and the last session of the year.
Inside pages are blurred on purpose: the specific levels, triggers and dates are what you’re paying for.
This isn't a countdown-timer trick. Q4 is already underway. Two of the quarter's 64 sessions are behind us, and the checklist's first deadlines land in the next two weeks.
Earnings season opens Oct 13. The Fed meets Oct 27–28. The midterm election is Nov 3. Quad witching is Dec 18. Every one of those dates is on the checklist, and every week you wait is one less date you can plan around.
The full Q4 Endgame report as a premium PDF, an editable Word edition, a one-page executive summary, the dated Q4 Action Checklist and the Q4 2026 key-dates calendar.
Instantly. Right after checkout, we email you a download link for the PDF and the Word edition.
Yes. Every figure comes from real market data, with prices through the most recent close before publication. The methodology and sources are listed at the end of the report. If we couldn't verify a number, it's not in there.
No. The report is educational. It explains what the data and the charts show and how experienced traders think about it. It isn't personalized advice or a recommendation to buy or sell anything.
Yes. It's written in plain language, every chart is explained, and every strategy ends with simple, dated next steps.
No. It's a one-time $99 purchase.
Ten strategies, one checklist, every key date. Built from real data by the Market Jukebox Research Team.
P.S. The report is built around dates, and the first ones on the checklist come up in the next two weeks. If you want a data-backed plan for the rest of 2026, now is when it's most useful.